All 57 lessons
Lesson 48 of 57 · Statistics and Exploratory Analysis
Regression Basics: Predicting with Linear Models in scikit-learn
By Skillancy Editorial Team
Run the code in the free Python Compiler or on your own computer. Lessons that read files use the FreshBasket practice data: download the dataset (ZIP).
Correlation tells you that two things move together. Regression goes one step further: it builds a formula that predicts one variable from others and tells you how much the prediction changes when an input changes. "Each extra unit in the basket adds about ₹X to the order value" is a regression statement, and so is "given this basket, we predict ₹Y".
This lesson introduces linear regression, the workhorse of prediction and the foundation for almost every machine-learning course. We fit a line with NumPy and SciPy, move to several inputs with scikit-learn, and read the coefficients. More importantly, we learn how to evaluate a model honestly: splitting data into training and test sets, comparing with a trivial baseline, using MAE, RMSE and R-squared, and checking residuals. We also deliberately try to predict something that cannot be predicted (delivery time) and see what a model with no signal looks like. Recognising "the model has found nothing" is as valuable as building a good one.
The code is short. The habits (hold out data, beat the baseline, plot the errors) are the real lesson.
Worked examples
Example 1: Build the modelling table
Question: What data do we have to predict order value?
import pandas as pd
import numpy as np

orders = pd.read_csv("orders.csv", parse_dates=["order_date"])
items = pd.read_csv("order_items.csv")
stores = pd.read_csv("stores.csv")

items["line"] = items["quantity"] * items["unit_price"]
basket = items.groupby("order_id").agg(units=("quantity", "sum"), lines=("product_id", "nunique"), value=("line", "sum"))

df = orders.merge(basket, on="order_id").merge(stores[["store_id", "city"]], on="store_id")
df = df[df["order_status"] == "Delivered"].reset_index(drop=True)
df["weekend"] = (df["order_date"].dt.dayofweek >= 5).astype(int)

print(len(df))
print(df[["units", "lines", "discount_pct", "weekend", "value"]].head(3))
Output
5391
   units  lines  discount_pct  weekend  value
0      1      1            15        0   78.0
1      2      2            15        0  146.0
2      5      2            15        0  276.0
How it works: Each row is one delivered order. The thing we want to predict, the target (value), and the inputs, the features (units, lines, discount_pct, weekend), live in the same table. reset_index(drop=True) gives clean row numbers after filtering.
Reading the result: We have 5391 delivered orders. Note that the target is basket value before discount; discount is only a feature.
Example 2: Simple linear regression
Question: How does order value change with units?
from scipy import stats

fit = stats.linregress(df["units"], df["value"])
print("slope    :", round(fit.slope, 2))
print("intercept:", round(fit.intercept, 2))
print("r        :", round(fit.rvalue, 3))
print("r squared:", round(fit.rvalue ** 2, 3))

# the same line with NumPy
slope, intercept = np.polyfit(df["units"], df["value"], 1)
print(np.isclose(slope, fit.slope))
print("predicted value for a 6-unit basket:", round(intercept + slope * 6, 1))
Output
slope    : 119.2
intercept: -2.58
r        : 0.715
r squared: 0.512
True
predicted value for a 6-unit basket: 712.6
How it works: Least squares chooses the line value = intercept + slope x units that makes the sum of squared prediction errors smallest. The slope is the average change in value for one extra unit, and the intercept is the predicted value at zero units (often not meaningful on its own). linregress also reports r; r-squared is the share of the variation in value explained by units.
Reading the result: Each extra unit adds about ₹119 to the order value, and the line explains 51% of the variation. A 6-unit basket is predicted at ₹713.
Example 3: Multiple regression with scikit-learn
Question: Do more inputs improve the prediction?
from sklearn.linear_model import LinearRegression
from sklearn.metrics import r2_score

features = ["units", "lines", "discount_pct", "weekend"]
X, y = df[features], df["value"]

model = LinearRegression().fit(X, y)
coefs = pd.Series(model.coef_, index=features).round(2)
print(coefs)
print("intercept:", round(model.intercept_, 2))
print("R-squared (training data):", round(r2_score(y, model.predict(X)), 3))
Output
units           121.42
lines            -5.17
discount_pct      0.93
weekend          -7.44
dtype: float64
intercept: -0.46
R-squared (training data): 0.512
How it works: The scikit-learn pattern is the same for every model: create the model, call fit(X, y), then predict(X_new). Each coefficient is the change in the prediction for a one-unit increase in that feature holding the others fixed. The scores here are computed on the same data the model learned from, which is optimistic, as the next examples show.
Reading the result: Holding the other features fixed, an extra unit adds ₹121 and each extra distinct product changes the prediction by -5 rupees, essentially nothing once the units are known. The discount and weekend coefficients (0.93 per percentage point and -7.4 rupees) are tiny next to the noise, consistent with the lack of correlation we saw earlier.
Example 4: Hold out a test set
Question: How well does the model predict orders it has never seen?
from sklearn.model_selection import train_test_split
from sklearn.metrics import mean_absolute_error, mean_squared_error

X_train, X_test, y_train, y_test = train_test_split(X, y, test_size=0.25, random_state=42)
model = LinearRegression().fit(X_train, y_train)
pred = model.predict(X_test)

print("train rows:", len(X_train), " test rows:", len(X_test))
print("R2 train:", round(model.score(X_train, y_train), 3))
print("R2 test :", round(r2_score(y_test, pred), 3))
print("MAE     :", round(mean_absolute_error(y_test, pred), 1))
print("RMSE    :", round(np.sqrt(mean_squared_error(y_test, pred)), 1))
Output
train rows: 4043  test rows: 1348
R2 train: 0.51
R2 test : 0.517
MAE     : 260.0
RMSE    : 359.5
How it works: We split the data: 75% to train the model, 25% to test it. The test rows play the role of "future orders", because the model never saw them while fitting. MAE (mean absolute error) is the average size of a miss in rupees. RMSE squares the errors first, so large misses count more. R-squared compares the model with simply predicting the mean. random_state makes the split reproducible.
Reading the result: On unseen orders the model explains 52% of the variation (R-squared) and is off by ₹260 on average (MAE). The training and test R-squared are close, so the model is not overfitting.
Example 5: Always beat the baseline
Question: Is that MAE actually good?
from sklearn.dummy import DummyRegressor

baseline = DummyRegressor(strategy="mean").fit(X_train, y_train)
base_pred = baseline.predict(X_test)

print("baseline MAE :", round(mean_absolute_error(y_test, base_pred), 1))
print("model MAE    :", round(mean_absolute_error(y_test, pred), 1))
print("baseline R2  :", round(r2_score(y_test, base_pred), 3))
improvement = 1 - mean_absolute_error(y_test, pred) / mean_absolute_error(y_test, base_pred)
print("MAE reduction:", f"{improvement:.1%}")
Output
baseline MAE : 386.4
model MAE    : 260.0
baseline R2  : -0.001
MAE reduction: 32.7%
How it works: A number such as "MAE = ₹200" means nothing alone. The baseline is the simplest sensible predictor: always guess the average. If a model cannot beat that, it has learned nothing useful. The baseline's R-squared is about zero by definition, and its MAE gives the yardstick.
Reading the result: Guessing the mean gives an MAE of ₹386; the model's MAE is ₹260, a 33% reduction. The model is clearly better than guessing.
Example 6: Residual plots
Question: Where does the model make its mistakes?
import matplotlib.pyplot as plt
import skillancy_style

resid = y_test - pred
fig, axes = plt.subplots(1, 2, figsize=(11, 4.2))
axes[0].scatter(pred, y_test, s=12, alpha=0.4, color="#028090")
lims = [0, pred.max()]
axes[0].plot(lims, lims, color="#E76F51", linewidth=2)
axes[0].set_xlabel("Predicted value (₹)")
axes[0].set_ylabel("Actual value (₹)")
axes[0].set_title("Predictions track reality, with a fan of noise", loc="left")

axes[1].scatter(pred, resid, s=12, alpha=0.4, color="#F4A261")
axes[1].axhline(0, color="#264653")
axes[1].set_xlabel("Predicted value (₹)")
axes[1].set_ylabel("Residual (actual - predicted)")
axes[1].set_title("Errors grow with the basket size", loc="left")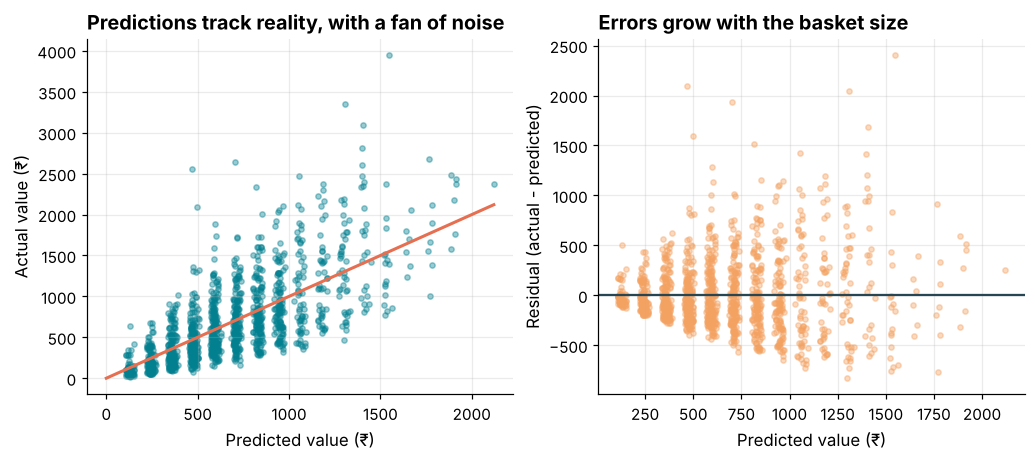
How it works: A residual is actual minus predicted. In the left plot, points on the diagonal are perfect predictions. In the right plot, residuals should look like a patternless band around zero. A funnel shape (errors growing with the prediction) is called heteroscedasticity: the model is less reliable for large baskets. A curve in the residuals would say a straight line is the wrong shape.
Reading the result: The residuals average 4.2 (centred on zero) but spread more as the predicted value grows. A log transform of the target is one remedy to try; the next example tests it.
Example 7: Log-transform the target
Question: Does modelling log(value) fix the widening errors?
y_train_log, y_test_log = np.log(y_train), np.log(y_test)
log_model = LinearRegression().fit(X_train, y_train_log)
pred_log = np.exp(log_model.predict(X_test))

print("R2 on rupees (log model)  :", round(r2_score(y_test, pred_log), 3))
print("MAE on rupees (log model) :", round(mean_absolute_error(y_test, pred_log), 1))
print("MAE on rupees (plain)     :", round(mean_absolute_error(y_test, pred), 1))
print("units coefficient (log)   :", round(log_model.coef_[0], 3), "->", f"{np.exp(log_model.coef_[0]) - 1:.1%} per unit")
Output
R2 on rupees (log model)  : 0.221
MAE on rupees (log model) : 288.8
MAE on rupees (plain)     : 260.0
units coefficient (log)   : 0.182 -> 19.9% per unit
How it works: Predicting log(value) and then exponentiating back turns the model multiplicative: each coefficient becomes "percentage change per unit", and relative errors become more uniform. We always judge the result in the original unit (rupees), so the comparison with the plain model is fair. A log model is not guaranteed to win on every metric; it is a tool for when errors scale with the size of the target.
Reading the result: The log model has MAE ₹289 against ₹260 for the plain model. So on this measure the log model does not win: it describes proportional errors well, but an MAE in rupees is dominated by the large baskets. Each extra unit raises the basket value by about 20%. Always judge a transformation on the metric the business cares about.
Example 8: Categorical features with one-hot encoding
Question: Does the city or delivery slot help predict the order value?
cat = pd.get_dummies(df[["city", "delivery_slot"]], drop_first=True, dtype=int)
X2 = pd.concat([df[features], cat], axis=1)
print("feature count:", X2.shape[1])

X2_train, X2_test, y2_train, y2_test = train_test_split(X2, y, test_size=0.25, random_state=42)
m2 = LinearRegression().fit(X2_train, y2_train)
print("R2 test with city+slot:", round(r2_score(y2_test, m2.predict(X2_test)), 3))
print("R2 test without       :", round(r2_score(y_test, pred), 3))
Output
feature count: 14
R2 test with city+slot: 0.518
R2 test without       : 0.517
How it works: Regression needs numbers, so categories become 0/1 columns, one per category (one-hot encoding). drop_first=True drops one category per variable, which acts as the reference level and avoids redundant columns. Because we used the same random_state, the split is identical, which makes the two R-squared values comparable.
Reading the result: Adding 10 city and slot columns changes the test R-squared by only 0.001: where and when someone orders tells us almost nothing about basket size.
Example 9: Overfitting and cross-validation
Question: Can a more complex model look better on training data and worse on new data?
from sklearn.preprocessing import PolynomialFeatures
from sklearn.pipeline import make_pipeline
from sklearn.model_selection import cross_val_score
import warnings
warnings.filterwarnings("ignore")

results = {}
for degree in (1, 3, 8):
    train_scores, cv_scores = [], []
    for seed in range(30):                      # 30 different small samples of 40 orders
        small = df.sample(40, random_state=seed)
        Xs, ys = small[["units"]], small["value"]
        pipe = make_pipeline(PolynomialFeatures(degree), LinearRegression())
        train_scores.append(pipe.fit(Xs, ys).score(Xs, ys))
        cv_scores.append(cross_val_score(pipe, Xs, ys, cv=5, scoring="r2").mean())
    results[degree] = (np.mean(train_scores), np.median(cv_scores))
    print(f"degree {degree}: train R2 {results[degree][0]:.3f}   cross-validated R2 (median) {results[degree][1]:.3f}")
Output
degree 1: train R2 0.525   cross-validated R2 (median) 0.217
degree 3: train R2 0.572   cross-validated R2 (median) 0.199
degree 8: train R2 0.575   cross-validated R2 (median) -6.796
How it works: A more flexible model (a higher-degree polynomial) always fits the training points at least as well, but it can start memorising noise: that is overfitting. Cross-validation (cross_val_score) repeatedly holds out part of the data, fits on the rest and scores on the held-out part, giving a more honest estimate. To avoid drawing conclusions from one lucky or unlucky sample, we repeat the experiment on 30 different samples of only 40 orders and take the median. Whenever training performance improves while validation performance falls, the model is memorising.
Reading the result: As the degree rises from 1 to 8 the average training R-squared creeps up (0.52 to 0.57), but the median cross-validated R-squared collapses from 0.22 to -6.8. The flexible model looks better on the data it has seen and is far worse on new data.
Example 10: When there is no signal
Question: Can we predict delivery time from order details?
dm = df.dropna(subset=["delivery_minutes"])
Xd = dm[features]
yd = dm["delivery_minutes"]
Xd_train, Xd_test, yd_train, yd_test = train_test_split(Xd, yd, test_size=0.25, random_state=42)

m_d = LinearRegression().fit(Xd_train, yd_train)
pred_d = m_d.predict(Xd_test)
base_d = DummyRegressor().fit(Xd_train, yd_train).predict(Xd_test)

print("R2 test:", round(r2_score(yd_test, pred_d), 4))
print("MAE model   :", round(mean_absolute_error(yd_test, pred_d), 2))
print("MAE baseline:", round(mean_absolute_error(yd_test, base_d), 2))
Output
R2 test: 0.0006
MAE model   : 5.5
MAE baseline: 5.5
How it works: We repeat the same recipe for delivery minutes. When a model has no signal to find, R-squared on the test set sits at or just below zero and the MAE is no better than the baseline. This is an answer, not a failure: the order details we have do not explain delivery time, so we should look for other information (distance, rider availability, traffic, weather) rather than a fancier algorithm.
Reading the result: The test R-squared is 0.001, and the MAE is 5.50 minutes against 5.50 for guessing the average. The model has found essentially nothing.
Common mistakes
1. Evaluating on the training data, which rewards memorisation. Always keep a test set.
2. No baseline. An R-squared of 0.5 or an MAE of ₹200 means nothing until you compare it with predicting the mean.
3. Reading coefficients as causes. They describe association in the data you have.
4. Extrapolating beyond the range of the training data, where a line may not hold.
5. Leaking information: using a feature that would not be known at prediction time (for example, using payment status to predict whether an order is cancelled).
LinearRegression().fit(df[["city"]], df["value"])Output
Traceback (most recent call last):
  File "example.py", line 1, in <module>
    LinearRegression().fit(df[["city"]], df["value"])
    ~~~~~~~~~~~~~~~~~~~~~~^^^^^^^^^^^^^^^^^^^^^^^^^^^
  File "example.py", line 1403, in wrapper
    return fit_method(estimator, *args, **kwargs)
  File "example.py", line 681, in fit
    X, y = validate_data(
           ~~~~~~~~~~~~~^
        self,
        ^^^^^
    ...<5 lines>...
        force_writeable=True,
        ^^^^^^^^^^^^^^^^^^^^^
    )
    ^
  File "example.py", line 3058, in validate_data
    X, y = check_X_y(X, y, **check_params)
           ~~~~~~~~~^^^^^^^^^^^^^^^^^^^^^^
  File "example.py", line 1330, in check_X_y
    X = check_array(
        X,
    ...<12 lines>...
        input_name="X",
    )
  File "example.py", line 1038, in check_array
    array = _asarray_with_order(array, order=order, dtype=dtype, xp=xp)
  File "example.py", line 983, in _asarray_with_order
    array = numpy.asarray(array, order=order, dtype=dtype)
  File "example.py", line 2027, in __array__
    arr = np.asarray(values, dtype=dtype)
ValueError: could not convert string to float: 'Mumbai'Practice questions
Practice 1 (Easy): Predict a single basket
Using the model from Example 4, predict the value of an order with 8 units, 5 lines, 0% discount, on a weekday.
Show solution
new = pd.DataFrame({"units": [8], "lines": [5], "discount_pct": [0], "weekend": [0]})
p8 = model.predict(new)[0]
print(round(p8, 1))
Output
938.1The model predicts ₹938. Always pass a DataFrame with the same column names and order the model was trained on.
Practice 2 (Medium): Compare MAE across cities
Using the Example 4 model's test predictions, compute the MAE per city and identify where the model is least accurate.
Show solution
test_cities = df.loc[X_test.index, "city"]
errors = pd.DataFrame({"city": test_cities, "abs_error": (y_test - pred).abs()})
by_city = errors.groupby("city")["abs_error"].mean().sort_values()
print(by_city.round(1))
Output
city
Kolkata      241.8
Chennai      246.6
Delhi        254.4
Mumbai       255.2
Bengaluru    258.8
Hyderabad    261.6
Ahmedabad    268.7
Pune         302.3
Name: abs_error, dtype: float64
The model is most accurate in Kolkata (MAE ₹242) and least in Pune (₹302). Checking errors by segment reveals where a model should not be trusted.
Practice 3 (Hard): Logistic regression for cancellations
Predict whether an order is cancelled from units, lines, discount_pct and weekend using LogisticRegression, and report the test ROC-AUC against the 0.5 you would get by guessing.
Show solution
from sklearn.linear_model import LogisticRegression
from sklearn.metrics import roc_auc_score

all_orders = orders.merge(basket, on="order_id")
all_orders["weekend"] = (all_orders["order_date"].dt.dayofweek >= 5).astype(int)
all_orders["cancelled"] = (all_orders["order_status"] == "Cancelled").astype(int)

Xc = all_orders[features]
yc = all_orders["cancelled"]
Xc_train, Xc_test, yc_train, yc_test = train_test_split(Xc, yc, test_size=0.25, random_state=42, stratify=yc)

clf = LogisticRegression(max_iter=1000).fit(Xc_train, yc_train)
auc = roc_auc_score(yc_test, clf.predict_proba(Xc_test)[:, 1])
print(round(yc.mean(), 4), round(auc, 3))
Output
0.0617 0.493Only 6.2% of orders are cancelled, so stratify keeps that rate in both splits. The ROC-AUC is 0.49: values near 0.5 mean the features cannot separate cancelled from delivered orders, another honest "no signal" result. (Accuracy would be misleading here: always predicting "not cancelled" is already 93.8% accurate.)
Key takeaways
- Regression predicts a numeric target; the slope says how much it changes per unit of a feature.
- The scikit-learn recipe is
fit,predict, andscoreor a metric on held-out data. - Always split data (or cross-validate), and always compare with a baseline.
- MAE is the typical miss in the target's unit; R-squared compares the model with predicting the mean.
- Plot residuals: curves or funnels show the model is missing something.
- A model with no signal is a result: it tells you to look for better data, not a fancier algorithm.
Frequently asked questions
What does R-squared mean?
It is the share of the target's variation explained by the model, compared with predicting the mean. 1 is perfect, 0 is no better than the mean, and negative means worse than the mean (possible on test data).
MAE or RMSE?
MAE is easier to explain ("off by ₹150 on average"). RMSE punishes large errors, so use it when big misses are especially costly. Report whichever matches the business pain, and consider both.
What is a good R-squared?
It depends on the problem. For physical processes 0.95 may be expected; for human behaviour 0.2 can be valuable. Always compare with a baseline and judge by usefulness.
How large should the test set be?
20% to 30% is common. With little data, use cross-validation instead of a single split.
Do I need to scale features for linear regression?
Not for the predictions of plain linear regression, but scaling makes coefficients comparable and is required for regularised models and for algorithms such as K-Means.
Linear regression seems too simple. Is it useless?
No. It is fast, explainable and a strong baseline. Many real models are linear regression with good features, and a complex model that cannot beat it is not worth deploying.
Keep learning Python
One email a week with Python and analytics guides, new practice questions and cohort dates. No spam, unsubscribe anytime.
Ready to practise? Try the Python interview questions