
Data Analytics vs Data Science: Differences, Skills, Salary in India and Which to Choose (2026)
By Skillancy Editorial Team · 25 October 2026 · 32 min read
Reviewed by Rishav Kumar, Principal Data Analyst, Walmart Global Tech
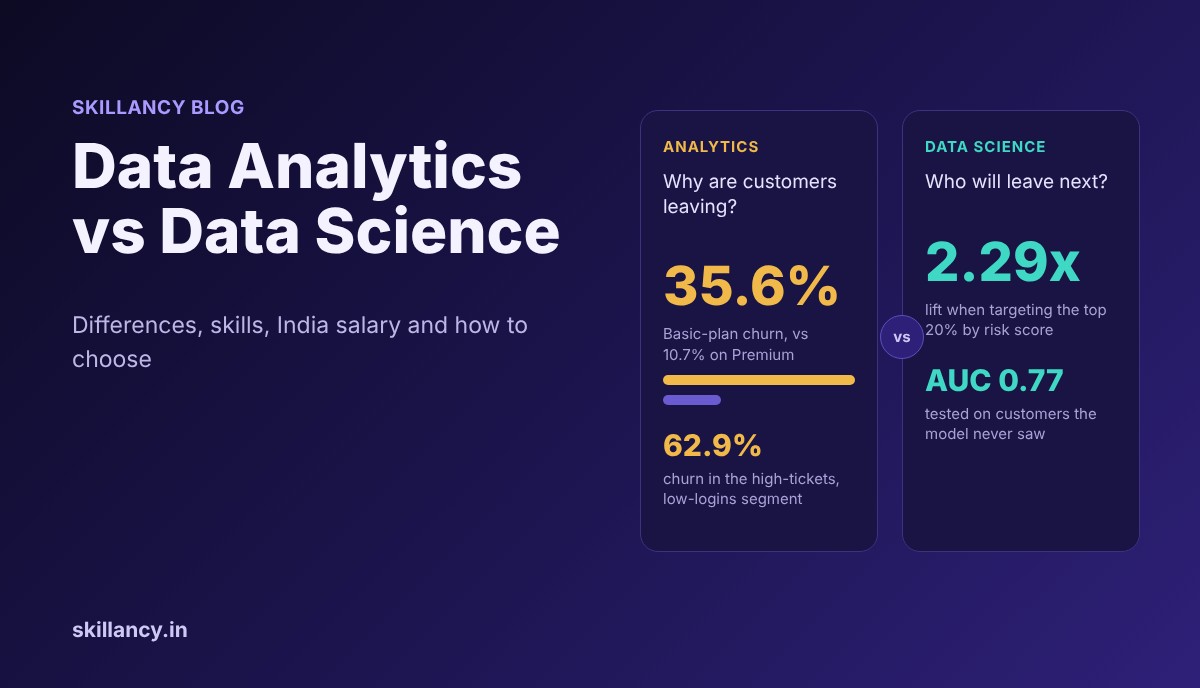
Data analytics vs data science is the most common career question in the data field, and most of the answers online are either too vague ("analysts look backward, scientists look forward") or too tool-focused ("analysts use Excel, scientists use Python"). Neither helps you decide. The real difference is in the kind of question each role is paid to answer, how much uncertainty each can tolerate, and how far each one is expected to go from a finding to a working system. This guide explains both fields in plain language, compares them side by side, walks through one business problem solved the analyst way and the data scientist way with real code and outputs, covers India salary ranges and the global outlook, shows how AI is reshaping both roles in 2026, and ends with a decision framework, a 90-day plan for each path and the interview answer you will need.
| Question | Short answer |
|---|---|
| Is data analytics a subset of data science? | Conceptually it overlaps with it; in hiring they are two distinct roles with different expectations |
| Which is easier to enter? | Data analytics, by a wide margin |
| Which pays more in India? | Data science at every level, but with a higher bar to get in |
| Which needs more maths? | Data science (linear algebra, probability, optimization) |
| Which needs more business sense? | Both, but analytics leans on it more day to day |
| Can I move from one to the other? | Yes. Analyst to data scientist is the most common path |
| Is AI replacing either? | AI is automating the routine parts of both; judgment and problem framing are what remain |
What is data analytics?
Data analytics is the process of collecting, cleaning, exploring and interpreting data to help a business make better decisions. A data analyst starts with a question that someone in the business cares about ("why did repeat orders drop in the south zone last month?"), finds the data that can answer it, checks that the data is trustworthy, analyses it, and communicates the answer in a form that a decision-maker can act on.
The output of analytics work is usually a number, a chart, a dashboard, a recommendation or a decision. It is judged by whether someone changed what they did because of it. An analyst who spots that a delivery partner's late-order rate doubled, shows the cause and gets the contract renegotiated has done the whole job.
Typical analytics work includes:
- Writing SQL to pull and combine data from several tables
- Cleaning and validating data (duplicates, missing values, mismatched definitions)
- Building and maintaining dashboards in Tableau, Power BI, Looker or Excel
- Tracking KPIs and explaining why they moved
- Running and reading A/B tests
- Presenting findings and recommendations to managers and cross-functional teams
Analytics roles carry many titles: data analyst, business analyst, product analyst, marketing analyst, BI analyst, supply chain analyst, financial analyst. The core craft is the same; the domain changes.
What is data science?
Data science is the practice of using statistics, programming and machine learning to extract knowledge and build predictive or automated systems from data. A data scientist often starts from a less specific problem ("can we predict which customers will cancel in the next 30 days, early enough to do something about it?"), frames it as something a model can learn, builds and evaluates that model, and works out how it will be used in a real process.
The output of data science work is usually a model, an experiment design, a forecast, a scoring system or a data product that other people or systems use repeatedly. It is judged by whether the model is accurate enough, stays accurate over time, and creates more value than it costs.
Typical data science work includes:
- Framing a business problem as a prediction, classification, ranking or optimization task
- Feature engineering from raw data
- Training and comparing models in Python (scikit-learn, XGBoost, PyTorch)
- Evaluating models properly (train/test splits, cross-validation, the right metric)
- Designing experiments and measuring causal effects
- Working with engineers to put models into production and monitor them
- Increasingly: working with large language models, embeddings and retrieval systems
The US Bureau of Labor Statistics describes data scientists as people who use analytical tools and techniques to extract meaningful insights from data, and lists duties that include cleaning and analysing data, building and testing models, visualizing findings and advising the business. The overlap with analytics is obvious from that description alone, and it is the reason the two terms get confused.
Learn it live: If you are still deciding, start with the shared foundation: SQL, statistics and Python. Our Data Analytics with Agentic AI program and Data Science with AI program both build it with live mentors.
Where data analytics and data science overlap
Before the differences, it helps to see how much the two share. If you learn the shared core first, you do not have to choose on day one.
| Shared skill | How analysts use it | How data scientists use it |
|---|---|---|
| SQL | Daily: pulling, joining and aggregating data | Daily: building training datasets and features |
| Data cleaning | Fixing duplicates, nulls, definitions | Same, plus handling leakage and label quality |
| Statistics | Distributions, significance, confidence intervals | Same, plus modelling assumptions and uncertainty |
| Python | pandas for analysis and automation | pandas plus modelling and production code |
| Visualization | Dashboards and stakeholder charts | Diagnostic plots and model explanations |
| Communication | Recommendations to business leaders | Explaining what a model does and does not do |
| Experimentation | Reading A/B test results | Designing and analysing experiments |
In small companies one person does both. In large companies the same person often moves between the two over a career. The titles differ more than the daily work in many roles.
Data analytics vs data science: the key differences
| Aspect | Data analytics | Data science |
|---|---|---|
| Core question | What happened, why, and what should we do? | What will happen, and can we automate the decision? |
| Typical starting point | A specific business question | An open-ended or loosely defined problem |
| Time horizon | Mostly past and present, increasingly near-term forecasts | Mostly future-oriented |
| Main techniques | Aggregation, segmentation, trend analysis, A/B tests, descriptive and inferential statistics | Machine learning, advanced statistics, optimization, causal inference, NLP |
| Primary tools | SQL, Excel, Tableau or Power BI, basic Python or R | Python, scikit-learn, XGBoost, PyTorch, notebooks, cloud ML tools |
| Mathematics needed | Statistics and probability fundamentals | Statistics, probability, linear algebra, calculus, optimization |
| Typical output | Insight, dashboard, report, recommendation | Model, forecast, scoring system, data product |
| How success is judged | Did a decision improve because of the analysis? | Is the model accurate, reliable and worth its cost? |
| Engineering depth | Light to moderate | Moderate to heavy (pipelines, deployment, monitoring) |
| Stakeholder contact | Constant, often daily | Frequent at the start and end of a project |
| Speed of work | Hours to days per question | Days to months per project |
| Tolerance for ambiguity | Moderate | High |
| Entry barrier | Lower | Higher |
| Typical entry education | Any graduate degree plus skills | Often a quantitative degree or a strong portfolio plus advanced skills |
A useful shorthand is that analytics reduces the cost of understanding a business, while data science reduces the cost of making repeated decisions. A one-off question suits an analyst. A decision made a million times a day, such as which product to recommend, suits a data scientist.
The four types of analytics: where each role sits
Analytics work is often described as a ladder of four types. Analysts spend most of their time on the first two; data scientists on the last two. The boundary is blurry, and strong people in both roles climb the full ladder.
| Type | Question it answers | Example | Usually owned by |
|---|---|---|---|
| Descriptive | What happened? | Monthly revenue fell 8% | Analyst |
| Diagnostic | Why did it happen? | The fall came from one region after a delivery delay | Analyst |
| Predictive | What is likely to happen? | These 600 customers are likely to churn this quarter | Data scientist (analysts increasingly share this) |
| Prescriptive | What should we do about it? | Offer a retention discount only to the segments where it pays back | Data scientist with analyst and business input |
The ladder also describes your growth path. A good analyst who learns statistics and Python moves into predictive work. A good data scientist who learns the business moves into prescriptive work, and becomes the person leadership trusts.
A day in the life: analyst vs data scientist
Job descriptions are abstract. This is what a typical day looks like. The details change by company, but the rhythm is representative.
A data analyst's day (supply chain team):
- 9:30 Check the morning dashboard; on-time delivery has dropped two points in one hub
- 10:00 Pull shipment data with SQL, join with carrier and route tables, find that the drop is concentrated in one carrier
- 11:30 Message the operations manager with the finding and a chart; agree on what to check next
- 13:30 Update the weekly business review deck with the new numbers
- 15:00 Meet the product team to define how "on-time" will be measured in the new tracking feature
- 16:30 Automate a manual Excel report with a scheduled SQL query and a Python script
A data scientist's day (same company):
- 9:30 Review the overnight run of the delivery-time prediction model; check error by region
- 10:30 Investigate why predictions for one carrier are drifting; find that a new route type is missing from the training data
- 12:00 Engineer new features (route type, weather, hub congestion) and retrain
- 14:00 Compare the new model with the current one on a held-out set, and by segment
- 15:30 Meet an engineer to plan how the updated model will be deployed and monitored
- 16:30 Write up the evaluation and the risks for the operations lead
Notice how each day connects to the other. The analyst's discovery that one carrier is failing becomes a feature for the model. The scientist's model produces predictions that the analyst's dashboard then tracks. In healthy teams, the two roles feed each other constantly.
Learn it live: The analyst's day is SQL plus judgment. Practise real queries in our SQL practice questions and run them in the SQL compiler.
Skills and tools compared
| Skill area | Data analytics: what you need | Data science: what you need |
|---|---|---|
| SQL | Strong: joins, window functions, CTEs, performance basics | Strong: same, plus building feature tables |
| Spreadsheets | Strong: Excel or Google Sheets, pivots, lookups | Light |
| BI and dashboards | Strong: Tableau, Power BI, Looker | Moderate |
| Python or R | Working level: pandas, plotting, automation | Advanced: pandas, NumPy, scikit-learn, deep-learning libraries |
| Statistics | Solid: distributions, hypothesis tests, regression basics | Deep: modelling, Bayesian ideas, causal inference, time series |
| Machine learning | Awareness; simple models when needed | Core: classification, regression, ensembles, evaluation, tuning |
| Mathematics | Comfortable with percentages, averages, variance | Linear algebra, calculus and optimization used conceptually |
| Domain knowledge | Very high value | High value |
| Data engineering | Basic: understand pipelines and warehouses | Moderate to strong: pipelines, versioning, deployment |
| Storytelling | Critical: it is the product | Important: it decides whether models get adopted |
| AI and LLM skills | Prompting, AI-assisted analysis, verifying output | Fine-tuning, RAG, embeddings, evaluation, agents |
If you want to see these skills broken down in more detail, we have written separate guides on data analyst skills for 2026 and the data science roadmap.
One problem, two approaches: a customer churn example in Python and SQL
Definitions only go so far. The clearest way to see the difference is to take one business problem and solve it the way each role would.
The situation: A subscription business has 4,000 customers across three plans (Basic, Standard, Premium). Leadership asks: "Churn is too high. What is going on, and what should we do?"
The data in this demo is simulated with a fixed random seed, so you will get the same numbers if you run it. It has plan, tenure in months, support tickets raised, monthly logins, price and whether the customer churned.
Part 1: the analyst's approach (describe and diagnose)
The analyst starts with SQL, because the data lives in a database:
SELECT plan,
       COUNT(*) AS customers,
       ROUND(100.0 * AVG(churn), 1) AS churn_pct,
       ROUND(AVG(tickets), 2) AS avg_tickets
FROM customers
GROUP BY plan
ORDER BY churn_pct DESC;
Real output:
    plan  customers  churn_pct  avg_tickets
   Basic       2023       35.6         2.20
Standard       1294       17.3         1.24
 Premium        683       10.7         1.21
Overall churn is 25.4%, but it is not spread evenly. Basic customers churn at 35.6%, more than three times the Premium rate, and they also raise the most support tickets. The analyst now goes one level deeper with pandas, grouping customers by how many tickets they raised:
df["ticket_band"] = pd.cut(df.tickets, [-1, 0, 2, 100], labels=["0", "1-2", "3+"])
df.groupby("ticket_band", observed=True).churn.agg(["size", "mean"])
customers churn_rate_%
ticket_band
0 802 10.7
1-2 2194 22.2
3+ 1004 44.4Churn rises from 10.7% for customers with no tickets to 44.4% for customers with three or more. Combining that with low engagement isolates a high-risk segment:
at_risk = df[(df.tickets >= 3) & (df.logins < 10)]High tickets + low logins segment: 367 customers, churn 62.9 %That is the analyst's deliverable: a clear, explainable finding. Basic-plan customers with repeated support problems and low usage churn at roughly 63%. The recommendation is concrete: investigate the support experience on the Basic plan, and flag these 367 accounts for outreach. The analyst did not build a model, and did not need to. A finding this strong already supports a decision.
Part 2: the data scientist's approach (predict and prescribe)
The analyst's segment rule is useful, but it only catches the customers who match one pattern. The data scientist asks a different question: can we score every customer's churn risk, early enough to act, and does acting pay off?
The scientist splits the data into training and test sets (so the model is judged on customers it has never seen), fits two models and compares them with a baseline:
Xtr, Xte, ytr, yte = train_test_split(X, y, test_size=0.25, random_state=7, stratify=y)
lr = LogisticRegression(max_iter=1000).fit(Xtr, ytr)
gb = GradientBoostingClassifier(random_state=7).fit(Xtr, ytr)
Baseline accuracy (always predict majority): 74.5 %
Logistic regression | AUC 0.77 | precision 0.675 | recall 0.302
Gradient boosting | AUC 0.769 | precision 0.635 | recall 0.286Four lessons are packed into these few lines, and each one is a data science habit:
1. A baseline comes first. A "model" that predicts "nobody churns" is already 74.5% accurate, because only a quarter of customers churn. Accuracy alone would have flattered a useless model.
2. Use the metric that fits the problem. AUC measures how well the model ranks customers by risk (0.5 is random, 1.0 is perfect). Precision and recall show the trade-off: at the default 0.5 threshold, the model is right 67.5% of the time when it flags someone, but it only catches 30% of real churners.
3. A more complex model is not automatically better. The fancier gradient boosting model did no better than plain logistic regression here (AUC 0.769 vs 0.77). In this simulated data the churn signal is simple, so the simple, explainable model wins.
4. Evaluate on business terms. The scientist converts the scores into a ranking and checks how well the top-scored customers actually churn:
Overall test churn rate: 25.5 % | churn in top 20% scored: 58.5 %
Lift in top 20%: 2.29 x
If the business contacts only the top fifth of customers by risk score, it reaches a group that churns at 58.5%, versus 25.5% for the average customer. That is a 2.29x lift: the model concentrates the problem.
The model also explains itself through its coefficients:
plan_Standard   -0.556
plan_Premium    -0.327
logins          -0.126
tenure          -0.033
tickets          0.419
Positive numbers push risk up, negative numbers push it down. Tickets raise risk; logins, tenure and the higher plans reduce it. (Basic is the reference plan, so it does not appear separately.) This confirms the analyst's findings, which is exactly what you want: two methods agreeing builds trust.
Part 3: the prescriptive step, and a result that should make you pause
Now the part that separates a model from a business decision. Suppose the company offers a 15% discount to the top 20% riskiest customers, and assume (an assumption, not a fact) that the offer saves 25% of customers who would otherwise leave. Is it worth it?
Illustrative annual revenue saved (INR): 120849 | discount cost (INR): 126540 | net: -5691It loses money. The discount is paid to every targeted customer, including the 41.5% who were never going to leave, so the cost swamps the revenue saved. A quick calculation shows the break-even: the offer only pays back if it saves roughly 26% of would-be churners (0.15 discount divided by the 58.5% churn rate in the targeted group). Whether it does is an empirical question. The right next step is not to launch the discount, but to run a randomized test on a small slice of the targeted customers, measure the real save rate, and also try cheaper interventions such as a support call.
This is what mature data science looks like. A model that ranks risk well is only a means; the decision depends on the economics, and the economics depend on an experiment. An analyst's judgment about the business and a scientist's modelling skill are both needed. (For more on proving that an action works, see our guide to correlation vs causation.)
Part 4: the trap that catches many new data scientists
One last demonstration, because it is the single most common way beginners fool themselves. Suppose a dataset includes a column called cancel_requested, recorded when a customer clicks the cancel button. It looks like a great predictor of churn. Add it and see:
Honest features | AUC 0.77
With leaked cancel_requested | AUC 0.974
AUC jumps from 0.77 to 0.974, and the model looks brilliant. But it is useless: by the time a customer clicks cancel, the churn has already happened. This is data leakage, where the model is given information it will not have at prediction time. Spotting leakage requires understanding the business process, not just the algorithm. It is a reminder that a high score is a claim to be checked, not a result to celebrate.
Learn it live: Run this kind of analysis yourself in the Python compiler and practise the supporting skills in our Python practice questions. Our Data Science with AI program covers model evaluation, leakage and experimentation step by step.
15 real-world situations: who handles what?
Titles blur in practice, so this table shows which role typically leads on 15 common situations. The "usually" matters: in small teams one person does everything, and strong analysts often handle the predictive items.
| # | Situation | Usually led by | Why |
|---|---|---|---|
| 1 | Revenue dropped last month; find out why | Analyst | Diagnostic work with SQL and segmentation |
| 2 | Build the weekly KPI dashboard for leadership | Analyst | BI and stakeholder communication |
| 3 | Read the result of a pricing A/B test | Analyst | Inferential statistics and clear reporting |
| 4 | Predict which customers will churn next month | Data scientist | Predictive modelling and evaluation |
| 5 | Forecast demand for 5,000 products by store | Data scientist | Time-series modelling at scale |
| 6 | Reconcile two reports that show different sales totals | Analyst | Data validation and definitions |
| 7 | Detect fraudulent transactions in real time | Data scientist | Classification, anomaly detection, deployment |
| 8 | Decide which marketing channel gets more budget | Analyst, with data scientist for attribution models | Business judgment plus measurement |
| 9 | Recommend products to each user on the app | Data scientist | Recommender systems at scale |
| 10 | Automate a manual monthly Excel report | Analyst | SQL plus Python automation |
| 11 | Estimate the true causal impact of a loyalty programme | Data scientist | Causal inference, quasi-experiments |
| 12 | Segment customers into groups for campaigns | Either | Analyst with rules; scientist with clustering |
| 13 | Optimize delivery routes to cut cost | Data scientist | Optimization and simulation |
| 14 | Define what "active user" means across the company | Analyst | Metric definition and governance |
| 15 | Build an AI assistant that answers questions from company data | Data scientist or AI engineer, with analyst on validation | LLMs, retrieval, evaluation |
The pattern: analysts own understanding and decisions; data scientists own prediction and automation. Row 12 shows the overlap, and row 15 shows where both fields are heading.
Career paths, titles and how people move between roles
| Stage | Data analytics path | Data science path |
|---|---|---|
| Entry | Junior data analyst, business analyst, MIS analyst | Junior data scientist (rare), data analyst moving into modelling, ML intern |
| Growth | Senior analyst, product analyst, analytics lead | Data scientist, senior data scientist, applied scientist |
| Specialist | Analytics engineer, BI developer, domain analytics (supply chain, finance, marketing) | ML engineer, research scientist, NLP or computer-vision specialist, AI engineer |
| Leadership | Analytics manager, head of analytics, director of insights | Lead data scientist, head of data science, chief data or AI officer |
Three observations about how careers in this field tend to move:
1. Many data scientists begin as analysts. True entry-level data science roles are scarce, especially in India, because companies want proof that you can handle real, messy data and real stakeholders. A common route is to join as an analyst, take on predictive projects, and move into a data science role within two to three years.
2. The boundary is crossed in both directions. Some data scientists move toward analytics leadership because they prefer decisions to modelling. Others move toward AI engineering and ML engineering. If AI engineering interests you, see our guide on how to become an AI engineer in India.
3. Domain depth beats title. An analyst who knows supply chain or fintech deeply is often more valuable than a generalist data scientist. The best long-term careers combine a technical core with a domain.
Data analytics vs data science salary in India
Salary is the question people care about most and the one most poorly answered online, so it is worth being careful. The ranges below are estimated annual CTC (cost to company) in lakh per annum, compiled by the Weekday salary guides, which combine employee-reported Glassdoor India salaries with 2025 and 2026 hiring data from platforms such as Instahyre and Hyring and cross-check them against published industry salary guides. They are approximate market ranges as of October 2026, not offers, and real pay varies a lot by company type, city and negotiation.
| Experience | Data analyst (₹ LPA) | Data scientist (₹ LPA) |
|---|---|---|
| Fresher | 3.5 to 6 (0 to 2 years) | 5 to 10 (0 to 1 year) |
| Early career (2 to 4 years) | 6 to 10 | 12 to 22 |
| Mid-level (5 to 7 years) | 8 to 15 (4 to 7 years) | 22 to 38 |
| Senior (7 to 12 years) | 15 to 25 (7 to 10 years) | 38 to 60 (8 to 12 years) |
| Lead, manager or head | 25 to 35 and above (10+ years) | 60 to 100 and above (12+ years) |
The experience bands in the two sources are not identical, so read each row as a rough comparison, not an exact match.
What the numbers tell you, and what they do not:
- Data science pays more at every level. The gap widens with seniority, because the role carries more technical depth and, at top companies, more direct revenue impact.
- The fresher number for data science is misleading. The same source notes that service companies start data science freshers at about ₹4.5 to 7 LPA, while top product companies and global capability centres (GCCs) can pay ₹15 to 25 LPA. Those top bands usually go to graduates of strong programmes with exceptional portfolios, not to the typical fresher.
- Fewer people actually get the high-paying data science jobs. Entry is harder, so the expected pay across everyone who tries is lower than the headline range.
- Company type matters more than title. A senior analyst at a high-paying product company can out-earn a data scientist at a services firm.
- Skills move pay. In both roles, people who combine strong SQL, Python, statistics, domain knowledge and AI skills sit at the top of their band.
For placement outcomes at Skillancy, please refer to the current figures on the Skillancy website, since they are updated with each batch.
The global picture
Outside India, the US Bureau of Labor Statistics reports that data scientist employment is projected to grow 35% from 2025 to 2035, far faster than the average for all occupations, from about 275,600 jobs in 2025. The median annual pay for data scientists was $120,230 in May 2025, and the typical entry requirement is a bachelor's degree, though many employers prefer a master's. Separately, the World Economic Forum's Future of Jobs Report 2025 ranks big data specialists as the fastest-growing job in percentage terms, ahead of fintech engineers and AI and machine learning specialists. Both point the same way: demand for people who can work with data is growing, and the growth is strongest at the more technical end.
That does not mean analytics is a weaker bet. Analytics roles are far more numerous, they exist in every industry and function, and they are the most reliable entry point into the field.
How AI is changing both roles in 2026
AI is not replacing either role, but it is changing which parts of each are valuable. This matters for your decision, because you are choosing a career for the next ten years, not the next ten months.
What AI is automating in analytics:
- Drafting SQL from a plain-English question
- Generating first-pass charts and dashboard layouts
- Summarizing a dataset or writing a first draft of a report
- Cleaning and reformatting routine data
What it is not automating, and what analysts are now paid for:
- Defining the right question and the right metric
- Spotting when an AI-generated query silently double-counts rows or drops records
- Knowing whether a pattern is real, spurious or a data bug
- Persuading a sceptical business team and getting a decision made
- Taking responsibility for a number that leadership will act on
What AI is automating in data science:
- Boilerplate modelling code and standard pipelines
- AutoML for tabular problems, where a respectable model takes minutes
- Hyperparameter tuning and basic feature suggestions
- Documentation and experiment tracking
What it is not automating:
- Framing the problem and choosing what to predict
- Detecting leakage, bias and distribution shift (see the demo above)
- Designing experiments to prove that an intervention works
- Evaluating LLM and agent systems, which is a fast-growing specialization
- Deciding when a model should not be used
The practical result is that the entry-level work in both fields is shrinking, while the judgment layer is growing. Candidates who can only follow tutorials are more replaceable than ever; candidates who can verify, question and explain are more valuable than ever. We cover how this is changing hiring in How Data Analyst Interviews Have Changed with AI and how analysts are using AI day to day in Data Analytics with AI in 2026. Agentic analytics, where AI agents turn business questions into verified analysis, is the newest frontier, and it is explored in Agentic Analytics with Natural Language Queries.
Learn it live: Our Data Analytics with Agentic AI program teaches analysts to use AI agents while still verifying every result, which is the skill employers now test.
Seven myths about data analytics vs data science
Myth 1: "Data science is just advanced data analytics." Partly true in techniques, false in emphasis. Data science adds modelling, engineering and experimentation to the toolkit and changes what the job is judged on. Many excellent analysts have no wish to become modellers, and they are not "less advanced".
Myth 2: "Data analysts do not need Python." Spreadsheets and BI tools cover a lot, but analysts who know Python and SQL automate their work, handle bigger data and move up faster. Python has become a baseline skill, not a data science exclusive.
Myth 3: "You need a PhD or a master's in statistics for data science." For research roles, often yes. For applied data science in industry, a bachelor's degree plus demonstrable skills and projects is enough at many companies, although some prefer advanced degrees.
Myth 4: "Data scientists spend most of their time building models." In practice, much of the time goes into understanding the problem, preparing data, evaluating and deploying, and model training is often the smaller share.
Myth 5: "Analytics is a dead end, data science is the destination." Analytics leads to analytics leadership, product and strategy roles, analytics engineering and, yes, data science. Many people stay in analytics for a whole career by choice and earn very well.
Myth 6: "The more complex the model, the better the data scientist." The churn example shows the opposite: the simple model matched the complex one. Good data scientists choose the simplest model that solves the problem.
Myth 7: "AI will make one of these jobs disappear." Routine tasks are being automated in both. The people who combine domain knowledge, statistical judgment and the ability to supervise AI are in more demand, not less.
Which one should you choose? A decision framework
Answer these honestly. There are no right answers, only answers that point you somewhere.
| If you... | Lean toward |
|---|---|
| Enjoy working directly with business teams and seeing your work change a decision within days | Analytics |
| Enjoy mathematics, proofs and understanding why an algorithm works | Data science |
| Want your first job within 6 to 9 months of focused learning | Analytics |
| Are willing to study for 12 to 24 months before a specialized role | Data science |
| Come from commerce, finance, operations, marketing or a non-technical background | Analytics first |
| Come from engineering, maths, statistics or computer science | Either; data science is a natural fit |
| Prefer clear, answerable questions | Analytics |
| Are comfortable when the problem is vague and the answer is uncertain | Data science |
| Want to build products and systems that run without you | Data science |
| Want to influence strategy and be close to leadership | Analytics |
| Are working and want to switch careers with minimal risk | Analytics, then grow |
A practical rule: if you are unsure, start with analytics. The skills (SQL, statistics, Python, communication) are the foundation of data science too. You will get paid sooner, learn on real data, and can move into modelling with evidence of what you enjoy. Starting in data science without analytics experience is possible, but it is the harder, less certain route for most people.
Another rule: do not choose by salary alone. A data scientist who dislikes modelling work will plateau; an analyst who loves the business will often out-earn a mismatched scientist within a few years.
A 90-day plan for each path
If you choose data analytics:
| Days | Focus | Output |
|---|---|---|
| 1 to 30 | Excel and SQL (joins, aggregation, window functions) and basic statistics | 50 solved SQL problems; a cleaned dataset |
| 31 to 60 | Tableau or Power BI, plus Python and pandas for analysis | A dashboard on a real dataset; a pandas analysis notebook |
| 61 to 90 | A/B testing, storytelling and 2 portfolio projects | Two end-to-end projects with written recommendations; resume and mock interviews |
Useful guides: How to Become a Data Analyst in India in 2026, Window Functions in SQL, Joins in SQL, Data Analysis Projects for Your Portfolio and Data Analyst Resume.
If you choose data science:
| Days | Focus | Output |
|---|---|---|
| 1 to 30 | Python, SQL and core statistics (distributions, hypothesis tests, regression) | A clean EDA notebook; 40 SQL problems |
| 31 to 60 | Machine learning basics: regression, classification, trees, evaluation, cross-validation | Two models with proper baselines and metrics |
| 61 to 90 | Feature engineering, model comparison, simple deployment and one end-to-end project | A portfolio project with a write-up of trade-offs, leakage checks and business value |
Useful guides: How to Become a Data Scientist in India in 2026, Data Science Roadmap 2026, Python for Data Science and Generative AI Roadmap 2026.
Learn it live: Prefer a structured path with mentors, projects and mock interviews? Explore Data Analytics with Agentic AI or Data Science with AI, or choose with our checklist in How to Choose a Data Analytics Course in India for Working Professionals.
How to answer "data analytics vs data science" in an interview
This question appears in interviews, and also as a way to test whether you understand the role you are applying for. A strong answer is short, specific and honest about overlap.
"Data analytics focuses on answering specific business questions from existing data: what happened, why, and what to do next, usually with SQL, BI tools and statistics. Data science goes further by building models that predict outcomes or automate decisions, which needs stronger programming, mathematics and machine-learning skills. They overlap a lot, and in practice they feed each other: an analyst's finding that one customer segment churns heavily becomes a feature or a target for a data scientist's model. For this role, I would bring..."
Then connect the answer to the job. If you are interviewing for an analyst role, end with a story about a decision you influenced. If you are interviewing for a data science role, end with a model you built and how you checked it was not leaking or overfitting.
Follow-up questions to prepare for:
- "Tell me about a time your analysis changed a decision." (Analyst-heavy.)
- "How would you know if your model is any good?" (Baseline, right metric, held-out data, business impact.)
- "A model scores 98% accuracy. Do you ship it?" (Check class balance and leakage first.)
- "How would you prove that a campaign caused the lift?" (Experiment or quasi-experiment; see correlation vs causation.)
- "When would you not use machine learning?" (When a rule, a simple analysis or a dashboard solves it more cheaply and clearly.)
More practice: Data Analyst Interview Questions for 2026 and our mock interviews.
Common mistakes people make when choosing between the two
1. Choosing by title rather than daily work. Read ten real job descriptions for each and see what the roles actually ask for.
2. Skipping the foundation. Jumping to deep learning without solid SQL and statistics produces fragile skills and weak interviews.
3. Collecting certificates instead of projects. Hiring teams look for evidence that you can handle messy data and explain decisions.
4. Ignoring the domain. Both roles reward people who understand supply chain, finance, retail or healthcare, not just tools.
5. Believing a high model score. Always ask about baselines, leakage and how the number will be used.
6. Treating the choice as permanent. The roles share a core, and moving between them is normal.
7. Waiting for the perfect decision. Start with the shared core; the choice becomes clearer with real work.
Frequently asked questions
What is the main difference between data analytics and data science?
Data analytics answers specific business questions from existing data, mostly explaining what happened and why. Data science builds predictive and automated systems using statistics, programming and machine learning. Analysts mainly explain and recommend; data scientists mainly predict and build.
Is data science harder than data analytics?
Data science generally requires more mathematics, programming and engineering, and has a higher entry barrier, so most people find it harder to enter. Analytics has its own difficulty, namely business judgment, stakeholder management and getting definitions right, which beginners often underestimate.
Which pays more in India, data analytics or data science?
Data science pays more at every experience level. As an approximate guide, data analysts earn about ₹3.5 to 6 LPA as freshers and ₹25 to 35 LPA or more at lead level, while data scientists earn about ₹5 to 10 LPA as freshers and ₹60 LPA or more at the top. These are estimates that vary by company and city, and the high data science bands are harder to reach.
Can I become a data scientist without a technical background?
Yes, but expect to build the foundations: Python, statistics and machine learning. The most common route is to start in analytics, learn on real data and move into predictive work. People from commerce, operations and finance often do this successfully because they bring domain knowledge.
Should a fresher start with data analytics or data science?
Most freshers should start with analytics. Entry-level data science roles are scarce, and the skills for analytics (SQL, statistics, Python, communication) are the same foundation that data science builds on. You can specialize later.
Do data analysts need to know machine learning?
Not deeply. Analysts should understand what machine learning can and cannot do, and be able to run simple models such as regression or clustering. As AI tools become common in analytics, awareness of model evaluation and its pitfalls is increasingly valuable.
Do data scientists need SQL?
Yes. SQL is used daily by data scientists to build datasets and features. Weak SQL is a common reason data science candidates fail interviews.
Is data analytics or data science better for the future?
Both are expected to stay in demand. The US Bureau of Labor Statistics projects 35% growth for data scientist jobs from 2025 to 2035, while analytics roles are broader and exist in nearly every industry. The fastest-growing opportunities combine data skills with AI and domain expertise.
Will AI replace data analysts or data scientists?
AI will automate routine tasks in both, such as drafting queries, charts and boilerplate model code. The parts that remain, and grow, are framing the right question, verifying outputs, catching errors like leakage or double-counting, running experiments and communicating with decision-makers.
What is the difference between a data analyst, a business analyst and a data scientist?
A data analyst works mostly with data to find and explain insights. A business analyst works mostly on processes, requirements and business problems, often with lighter data work. A data scientist builds statistical and machine-learning models. In practice, the titles overlap, so always read the job description.
Can I do both at the same time?
In small companies you often must. In larger ones, you can build analytics depth first and add data science skills over time. Learning them in sequence, with analytics first, is usually more efficient than learning both at once.
How long does it take to become job-ready in each?
With consistent effort, many learners become job-ready for analyst roles in roughly 6 to 9 months and for entry-level data science roles in about 12 to 24 months, depending on background, time per week and the quality of projects. These are estimates, not guarantees.
Recommended internal links
- Data Analytics with Agentic AI program: https://skillancy.in/courses/data-analytics-with-agentic-ai
- Data Science with AI program: https://skillancy.in/courses/data-science-with-ai
- How to become a data analyst in India: https://skillancy.in/blog/how-to-become-a-data-analyst-in-india-2026
- How to become a data scientist in India: https://skillancy.in/blog/how-to-become-data-scientist-india-2026
- Data analyst skills for 2026: https://skillancy.in/blog/data-analyst-skills-2026
- Data science roadmap 2026: https://skillancy.in/blog/data-science-roadmap-2026
- Python for data science: https://skillancy.in/blog/python-for-data-science
- Correlation vs causation: https://skillancy.in/blog/correlation-vs-causation
- Data analyst interview questions: https://skillancy.in/blog/data-analyst-interview-questions
- Free SQL compiler: https://skillancy.in/tools/sql-compiler
- Free Python compiler: https://skillancy.in/tools/python-compiler
- Mock interviews: https://skillancy.in/mock-interviews
Sources and publishing references
US Bureau of Labor Statistics, Occupational Outlook Handbook: Data Scientists (median pay May 2025, 35% projected growth 2025 to 2035, 275,600 jobs in 2025): https://www.bls.gov/ooh/math/data-scientists.htm
World Economic Forum, Future of Jobs Report 2025, fastest-growing jobs summary on E-Trade for All: https://etradeforall.org/node/12999
Weekday, Data Analyst Salary in India 2026 (estimated CTC ranges, last updated October 2026): https://www.weekday.works/post/data-analyst-salary-in-india-2026
Weekday, Data Scientist Salary in India 2026 (estimated CTC ranges, last updated October 2026): https://www.weekday.works/post/data-scientist-salary-in-india-2026
Skillancy homepage: https://skillancy.in/
Google helpful content guidance: https://developers.google.com/search/docs/fundamentals/creating-helpful-content
Salary figures are approximate market estimates compiled from public aggregators and are not offers or guarantees. The churn example uses a simulated dataset with a fixed random seed; all Python and SQL outputs on this page were produced by running the code with NumPy 2.5, pandas 3.0, scikit-learn 1.9 and SQLite, so you will get the same numbers.
Get the Skillancy field notes
One email a week: AI and analytics guides, cohort dates and hiring signals. No spam, unsubscribe anytime.