
Data Analyst Interview Questions for 2026: SQL, Excel, Statistics, Python & Case Rounds
By Skillancy Editorial Team · 20 October 2026 · 7 min read
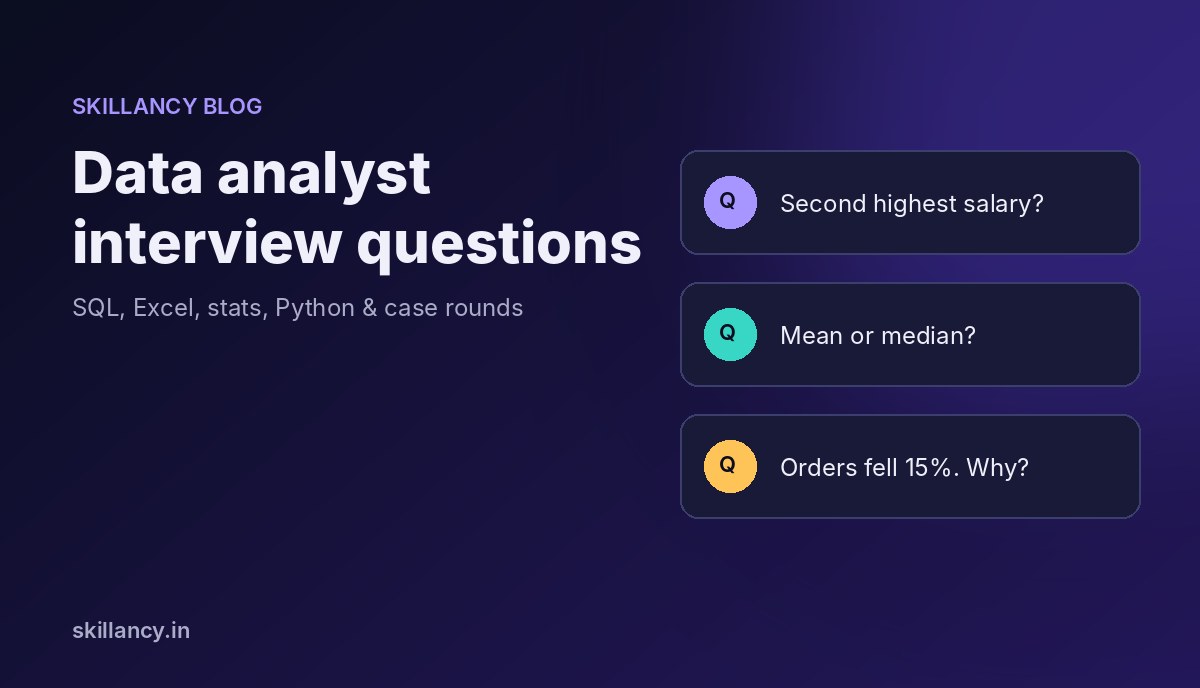
Data analyst interview questions in India usually come in five rounds: SQL, Excel, statistics, Python, and a business case or guesstimate, with behavioral questions threaded through all of them. This guide gives you the questions that come up again and again in each round, with model answers and working code, plus what the interviewer is really checking. It is written by practitioners who interview analyst candidates, so the emphasis is on how to answer, not just what to answer.
How data analyst interviews are structured
| Round | What it tests | How to prepare |
|---|---|---|
| SQL screen | Joins, aggregation, window functions, edge cases | Solve problems in a live editor and explain each step |
| Excel or BI | Lookups, pivots, cleaning, dashboard thinking | Rebuild a small report from raw data |
| Statistics | Distributions, averages, sampling, A/B tests | Explain concepts with a business example |
| Python | pandas cleaning, grouping, merging | Practice on messy data, not only clean exercises |
| Case / guesstimate | Structuring an ambiguous problem | Talk through a framework before numbers |
Not every company runs every round. Service and consulting firms often lean on SQL and Excel; product companies add a stronger case round and sometimes Python.
SQL interview questions
The examples use a customers table, an orders table (order_id, customer_id, order_date, amount) and an employees table (name, dept, salary). You can run every query in the free Skillancy SQL compiler.
1. Find the second highest salary.
SELECT MAX(salary) AS second_highest_salary
FROM employees
WHERE salary < (SELECT MAX(salary) FROM employees);
What they check: whether you think about ties and about an empty result if everyone earns the same. Mention that DENSE_RANK() generalizes to the Nth highest.
2. Which customers placed more than one order?
SELECT customer_id, COUNT(*) AS order_count
FROM orders
GROUP BY customer_id
HAVING COUNT(*) > 1
ORDER BY customer_id;
What they check: that you know WHERE filters rows before grouping and HAVING filters groups after.
3. Show a running total of revenue by date.
SELECT order_date, amount,
       SUM(amount) OVER (ORDER BY order_date) AS running_total
FROM orders
ORDER BY order_date;
What they check: comfort with window functions and the difference between a window and GROUP BY (rows are not collapsed).
4. List employees who earn more than their department's average.
SELECT name, dept, salary
FROM (
  SELECT name, dept, salary,
         AVG(salary) OVER (PARTITION BY dept) AS dept_avg
  FROM employees
) t
WHERE salary > dept_avg
ORDER BY dept, name;
What they check: that you know a window function cannot be filtered in the same SELECT, so you wrap it in a subquery or a CTE.
5. Which customers have never ordered?
Use a LEFT JOIN from customers to orders and keep rows where the order ID is NULL. If you are unsure why that works, or why putting a right-table filter in WHERE breaks a LEFT JOIN, read our guide to joins in SQL before your interview. For multi-step questions, our guide to CTE in SQL shows how to structure them.
For more practice, our free set of 25 SQL interview questions checks your answers instantly in a real Postgres editor.
Excel interview questions
6. VLOOKUP vs XLOOKUP vs INDEX-MATCH?
VLOOKUP looks only to the right of the lookup column and breaks when columns are inserted. INDEX-MATCH removes both limits. XLOOKUP, available in newer versions of Excel, can look in any direction, returns a default when nothing matches, and defaults to exact match. Say which you would use and why.
7. How would you summarize 50,000 rows of sales by region and month?
A pivot table, with the data first converted to an Excel Table so new rows are picked up on refresh. Mention checking for blank or inconsistent region names before pivoting.
8. How do you find and remove duplicates?
Decide first what counts as a duplicate (same order ID, or same customer, date and amount). Use conditional formatting or COUNTIFS to flag them so you can inspect before deleting; Remove Duplicates deletes without showing you what went.
Statistics interview questions
9. When would you report the median instead of the mean?
When the data is skewed or has outliers, such as order values or salaries. A few very large values pull the mean up; the median shows the typical case.
10. Correlation vs causation?
Correlation means two measures move together. Causation means one changes the other. Ice-cream sales and sunburn correlate because both rise in summer. To claim causation you need a controlled experiment, such as an A/B test, or a careful design that rules out other explanations.
11. What is a p-value, in plain words?
If there were truly no difference between groups, the p-value is the chance of seeing a difference at least as large as the one observed. A small p-value suggests the difference is unlikely to be noise alone; it does not tell you the size or business value of the effect.
Python and pandas interview questions
12. How do you find and handle missing values?
orders["amount"].isna().sum()                                   # count missing
orders["amount"] = orders["amount"].fillna(orders["amount"].median())
What they check: that you ask why the value is missing before choosing to fill, drop or flag it. Filling a missing amount with the median is a choice, not a default.
13. Revenue by city, keeping cities with no orders.
result = (
    customers.merge(orders, on="customer_id", how="left")
    .groupby("city", as_index=False)["amount"].sum()
    .sort_values("amount", ascending=False)
)
A good follow-up to raise yourself: sum() skips missing values, so a city whose only order has a missing amount and a city with no orders both show 0. If that distinction matters, count orders as well.
Case and guesstimate questions
14. "Daily orders dropped 15% yesterday. How would you investigate?"
Structure before numbers. First confirm the drop is real (data pipeline, tracking changes, a holiday or a comparison against the wrong day). Then segment: platform, city, new vs returning users, category, traffic source. Find where the drop is concentrated, form a hypothesis, and say what data would confirm it. Interviewers reward the order of thinking more than the final answer.
15. "Estimate the number of food delivery orders in Bengaluru per day."
State a population, the share of people who order online, how often they order, and sanity-check the result against something you know. Round numbers are fine; explain each assumption.
Behavioral questions
- Tell me about an analysis that changed a decision.
- Describe a time your numbers were wrong. How did you find out and what did you change?
- How do you explain a technical result to a non-technical stakeholder?
Use the situation, task, action, result structure, and include a number in the result wherever you honestly can.
How to prepare in the last two weeks
- Solve two or three SQL problems a day from a blank editor, and explain each one out loud.
- Rebuild one project end to end so you can walk through it confidently; see our list of data analysis projects for ideas.
- Update your data analyst resume so every bullet can survive a "tell me more".
- Do at least one mock interview with someone who hires analysts. You can book one on our mock interviews page.
Frequently asked questions
What are the most common data analyst interview questions?
SQL joins and aggregation, window functions such as running totals and ranking, Excel lookups and pivots, mean vs median, correlation vs causation, and a case question about investigating a change in a metric.
Is SQL or Python more important for data analyst interviews?
SQL is tested in almost every analyst interview. Python is common at product companies and in data-heavy roles, and less consistent elsewhere. Prepare SQL first.
How should a fresher prepare for a data analyst interview?
Master SQL fundamentals, prepare one or two projects you can explain in depth, practice explaining your reasoning out loud, and review basic statistics with business examples.
Do data analyst interviews include guesstimates?
Many do, especially at product companies and consulting firms. The goal is to see how you structure an ambiguous problem, not whether you hit an exact number.
Recommended internal links
- 25 SQL interview questions with a live editor: https://skillancy.in/practice/sql-questions
- Python interview questions with a live editor: https://skillancy.in/practice/python-questions
- Book a mock interview: https://skillancy.in/mock-interviews
- Data Analytics with Agentic AI program: https://skillancy.in/courses/data-analytics-with-agentic-ai
Sources and publishing references
PostgreSQL documentation: Window functions: https://www.postgresql.org/docs/current/tutorial-window.html
pandas documentation: Working with missing data: https://pandas.pydata.org/docs/user_guide/missing_data.html
All SQL outputs referenced on this page were checked by running the queries against PostgreSQL, and the pandas snippets were run against pandas.