

Rishav Kumar
Principal Data Analyst
Excel to AI Agent — Zero to Analyst in 3 Months
A 3-month, 96-hour weekend program that takes you from Excel and statistics to SQL, Tableau, Python and agentic AI. 8 real-world capstone projects, mock interviews and placement prep across 5 phases.
Program fee
or ₹950/month with EMI
Your coupon discount is shown before payment.
Get the detailed syllabus, batch dates and fee options.
Overview
Excel to AI Agent — Zero to Analyst in 3 Months. 72 hours of core training plus a 24-hour case study and interview track, delivered live on Saturdays and Sundays. Built for students, non-tech backgrounds, working professionals and career-break returners — no prior coding needed.
Outcomes
Analyse business data confidently in Excel with pivot tables, lookups and statistics
Write advanced SQL with CTEs, window functions and analytical joins
Build interactive KPI dashboards and data stories in Tableau
Automate analysis with Python, NumPy, Pandas, Matplotlib and Seaborn
Build your own no-code AI agent with Make.com and API integrations
Ship 8 real-world capstone projects and clear mock interviews with feedback
Meet your instructors
Principal Data Analyst

Data Analyst

Senior Data Analyst
Student success stories
“One of the most impactful learning experiences of my analytics journey — especially SQL and Python. Real-world scenarios and case studies strengthened my analytical thinking.”

Sanghamitra Phukan
Oracle
“Skillancy's mentorship went beyond interview prep — teaching me how to think critically and solve real-world problems, with end-to-end support throughout.”

Jayant Khanna
PayPal
“Structured, industry-aligned training helped me secure a role at ZoomInfo. Hands-on, real-world problem-solving strengthened my technical skills and confidence.”

Mohammad Ammar
ZoomInfo
“Key to transitioning into analytics without prior experience. Structured mentorship and rigorous SQL training built strong technical confidence, plus valuable career planning.”

Umashankar Pati
RSystems
“Crucial in helping me transition into data analytics from a non-technical background. Patient mentorship and guidance in resume building and interview prep were instrumental.”

Ankita Singh
EXL Services
Hiring partners


 Target
Weekly schedule
Five phases, twelve weeks, one continuous build from spreadsheets to a placement-ready portfolio.
Phase 1
Phase 2
Phase 3
Phase 4
Phase 5
Core content (6 hrs) · Week 1
Sunday case / interview track (2 hrs)
Core content (6 hrs) · Week 2
Sunday case / interview track (2 hrs)
Retail Sales & Inventory Performance Analysis — DMart (Excel)
Core content (6 hrs) · Week 3
Sunday case / interview track (2 hrs)
Core content (6 hrs) · Week 4
Sunday case / interview track (2 hrs)
Core content (6 hrs) · Week 5
Sunday case / interview track (2 hrs)
E-commerce Order & Customer Segmentation Analysis — Flipkart (SQL)
Core content (6 hrs) · Week 6
Sunday case / interview track (2 hrs)
Core content (6 hrs) · Week 7
Sunday case / interview track (2 hrs)
 Sales & Marketing Performance Dashboard — Ola (Tableau)
Core content (6 hrs) · Week 8
Sunday case / interview track (2 hrs)
Core content (6 hrs) · Week 9
Sunday case / interview track (2 hrs)
Core content (6 hrs) · Week 10
Sunday case / interview track (2 hrs)
Customer Churn Prediction & Behavior Analysis — Zomato (Python)
Core content (6 hrs) · Week 11
Sunday case / interview track (2 hrs)
Core content (6 hrs) · Week 12
Sunday case / interview track (2 hrs)
Capstone projects
Excel · DMart
Pivot tables, lookups & stats applied to a multi-store retail dataset
SQL · Flipkart
CTEs & window functions used to segment customers by order behavior
Python · Zomato
Pandas-based cleaning & feature analysis on delivery data
Tableau · Ola
An interactive KPI dashboard built for a leadership review
Excel · BigBasket
Pivot tables & lookups measuring discount impact and delivery SLAs across dark stores
SQL · Myntra
CTEs & window functions analyzing return rates and CLV across fashion categories
Python · Paytm
Pandas-based cleaning & EDA on digital payment transaction data
Tableau · MakeMyTrip
Interactive dashboard tracking booking trends, seasonality & revenue by route
Toolkit
 Excel
Excel Matplotlib
Get certified
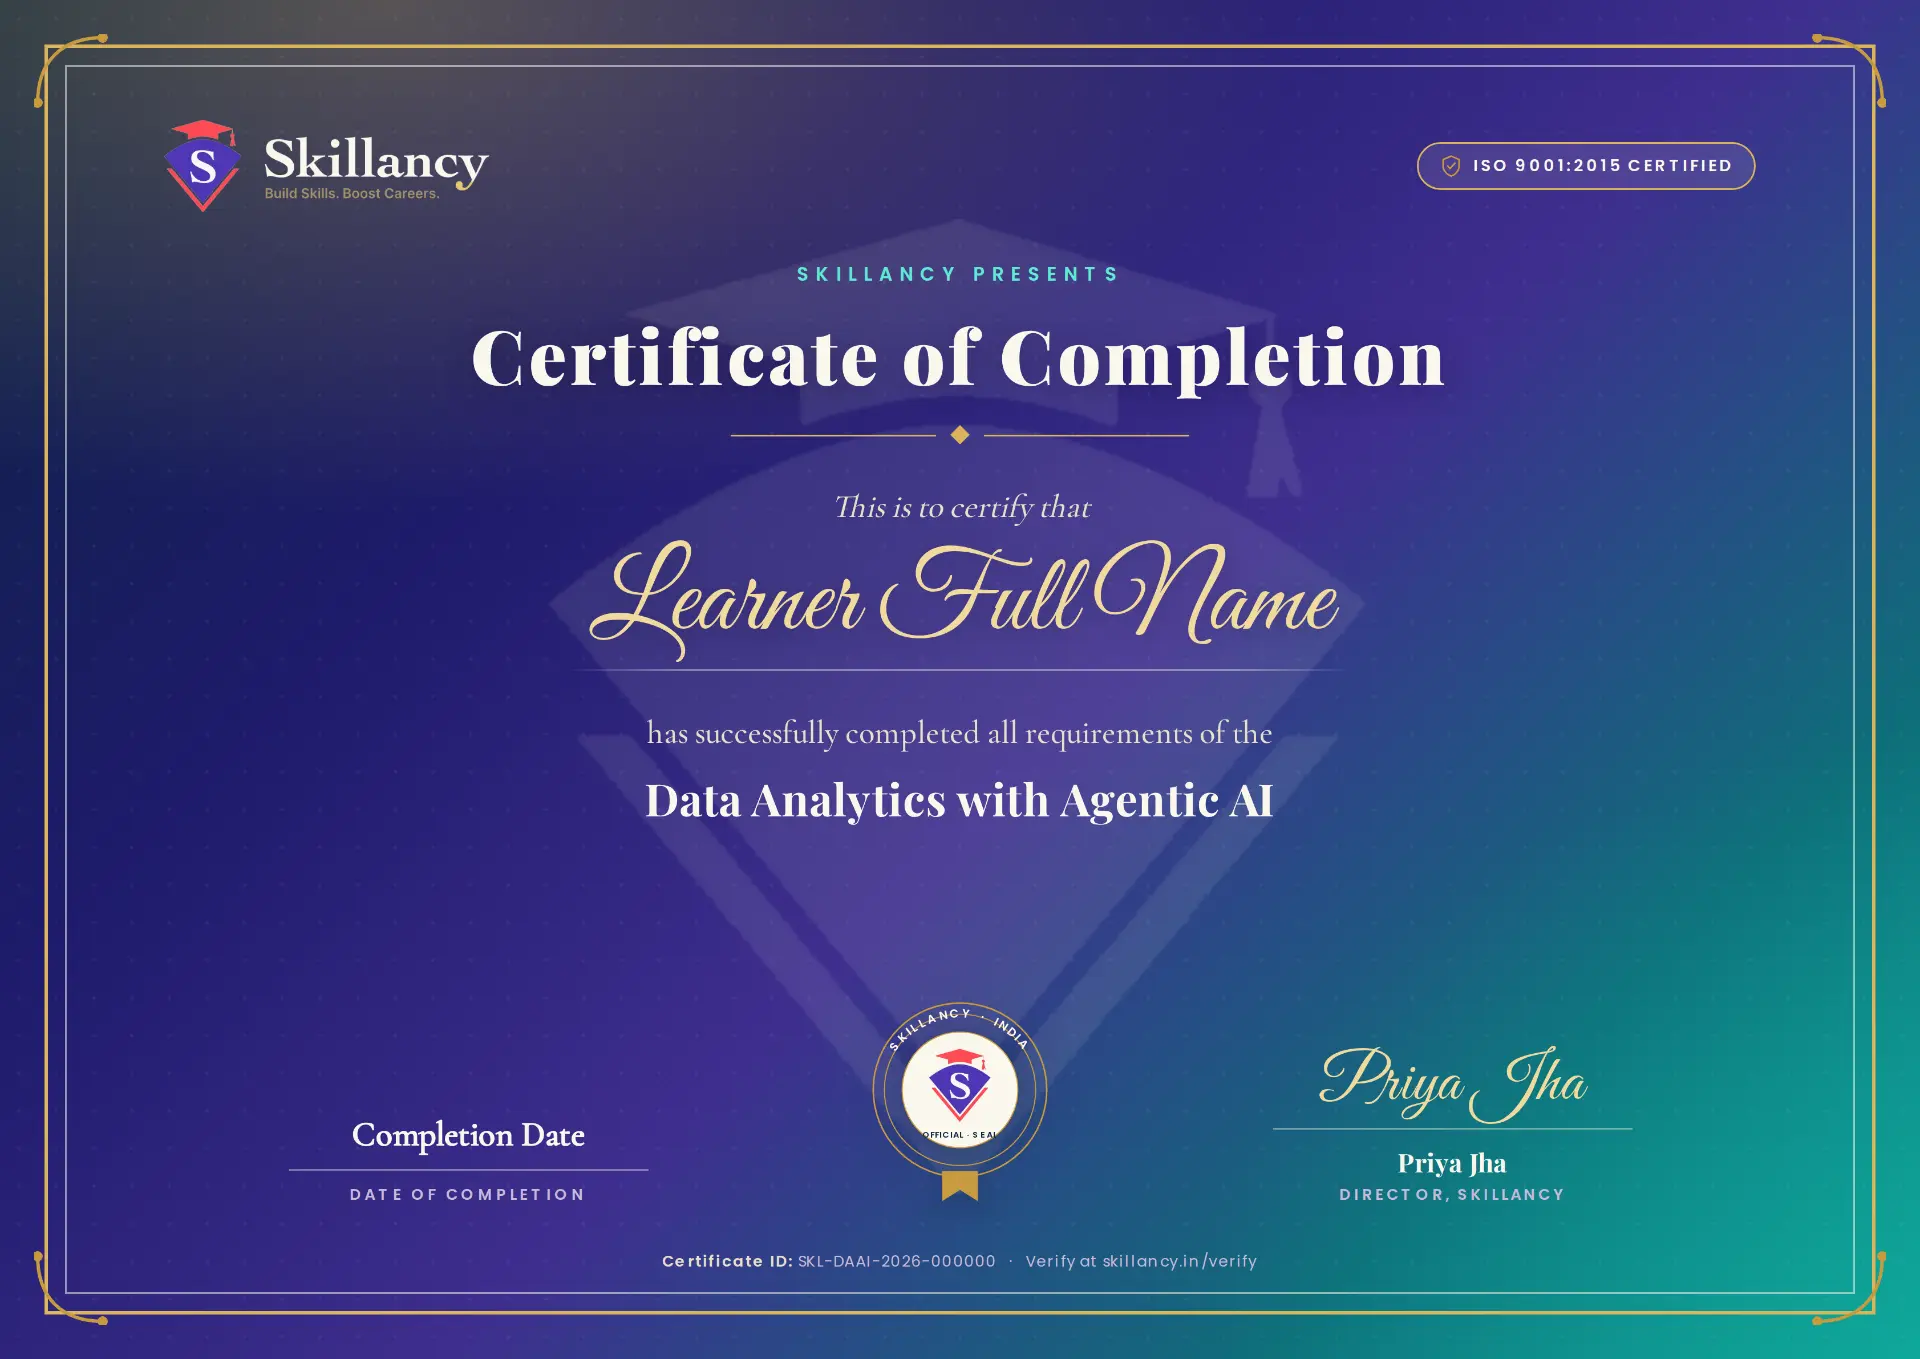
Every learner who completes the program receives a Certificate of Completion from Skillancy.
Practice
Every Data Analytics with Agentic AI learner gets unlimited access to our in-browser practice sets. Start with these Python and SQL interview questions — no signup, code runs in your browser.
30 problems with hints, tests and explanations
25 problems on a real in-browser Postgres engine
FAQ
Career Hub
Recent openings in India. Updated daily.
Enrol securely online and get immediate access to your learner dashboard. Apply an eligible coupon before you pay, or speak with a mentor if you need guidance.
Talk to a mentorProgram fee
or ₹950/month with EMI
Your coupon discount is shown before payment.